For 141 countries, a life uses births, survival, income, schooling, health and life satisfaction taken from public statistics. The age at death comes from each country’s life tables by sex. Causes of death follow WHO and GBD patterns by region and age.
Births
Births and population come from UN World Population Prospects 2024.
Each country leads with a share of the babies being born now, then odds as 1 in N, and a rounded population under the title. Those two counts are the two ways a birthplace is drawn. Both come from that same UN revision.
India is 17.68% of births, 1 in 6. Qatar is 0.02%, 1 in 4,450.
Life expectancy by sex
Life expectancy is shown for women and men in each country.
The large figure is the combined expectancy. Women and men share the same cell. A life in today’s world uses today’s tables. A past world uses that year’s statistics, and the coming world uses UN projections.
Infant and under-5 mortality
Child mortality comes from UN IGME.
Each country gives the chance of dying before age 1 and before age 5, both as a percent and as deaths in 1,000. Child mortality is UN IGME, separate from the UN population series used for births and fertility.
Income per person
Income per person is shown in PPP dollars, with inequality beside it.
The income line is GDP per capita at purchasing-power parity. The Gini index sits beside it, and a number closer to 0 is more equal. In a life, income is drawn from that distribution. A sum is a PPP dollar shown as it would feel at US prices. Those income figures come from the World Bank’s world development indicators, mostly by way of Our World in Data.
Schooling and university
Years of schooling and university enrollment are part of the country cards.
Expected years of schooling and the university gross enrollment ratio are the education lines. Schooling comes from UNDP and UNESCO, through UNESCO UIS and the UNDP human development report.
Health and safety
The cards include maternal mortality, HIV, homicide, road deaths, smoking and out-of-pocket health costs.
Maternal mortality, tobacco and road deaths come from WHO and UN MMEIG, and smoking and health spending come from WHO. HIV is UNAIDS. Homicide is UNODC. Out-of-pocket health spending and internet use are World Bank lines. Jobs in agriculture are ILO. The share of people living in cities is UN-Habitat.
Fertility and child marriage
Fertility and the share of women married before 18 are part of every country.
Fertility is the total fertility rate, children per woman, from UN World Population Prospects 2024. Child marriage is the UNICEF share of women aged 20–24 who married before 18. Some child-marriage rates, and some road-death rates, were estimated from regional averages.
Life satisfaction
Life satisfaction uses the World Happiness Report 2024 and is missing where that report has no score.
The score is out of 10. A country with no score in that report has no satisfaction line. The other lines for that country still come from the sources above.
7 countries leave the score off: Cuba, Equatorial Guinea, Eritrea, Guinea-Bissau, North Korea, Oman, and Papua New Guinea. The scored countries run from 1.72 / 10 in Afghanistan to 7.74 / 10 in Finland.
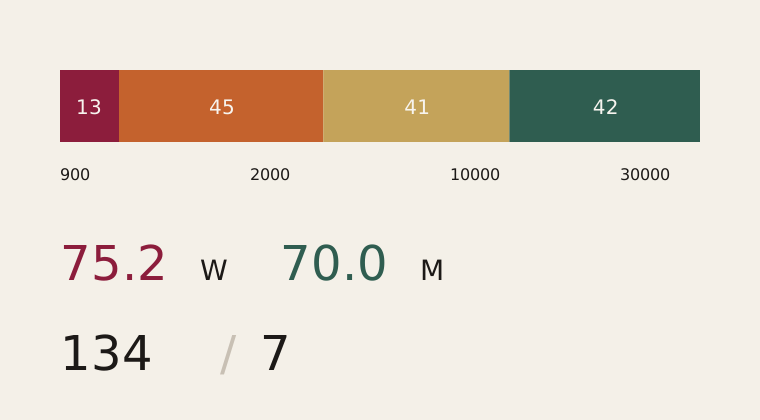
Income per person for the 141 countries: 13 under $2,000, 45 from $2,000 to under $10,000, 41 from $10,000 to under $30,000, and 42 at $30,000 or more. Mean life expectancy is 75.2 years for women and 70.0 for men. Life satisfaction is scored for 134 countries and missing for 7.
Income, expectancy and satisfaction
Of the 141 incomes, 13 are under $2,000, 45 run from $2,000 to under $10,000, 41 from $10,000 to under $30,000, and 42 are $30,000 or more. Yemen’s income is $2,000, so it sits in the second band. The lowest income is $900 in South Sudan. The highest is $130,297 in Singapore.
Across the 141 countries, mean life expectancy is 75.2 years for women and 70.0 years for men. Life satisfaction is scored for 134 countries.
Which publication sits behind which line
Births, survival, income and the rest come from the same families of statistics. Most of them arrived by way of Our World in Data, and a world that is not today adds further series. WHO, UN MMEIG, UN-Habitat and the education reports are named on their own lines.
Figure
Comes from
Births, population, life expectancy, fertility
UN World Population Prospects 2024
Chance of dying before age 1, and before age 5
UN IGME
Maternal mortality, smoking, road traffic deaths
WHO and UN MMEIG. Maternal mortality, smoking and health spending come from WHO.
Expected years of schooling, university enrollment
UNDP and UNESCO, through UNESCO UIS and the UNDP human development report.
Income per person (PPP), income inequality, internet use, out-of-pocket health costs
World Bank world development indicators
People working in farming
ILO
People living in cities
UN-Habitat. Past and coming worlds also use World Urbanization Prospects 2018.
HIV
UNAIDS
Homicide
UNODC
Women married before 18
UNICEF
Life satisfaction
World Happiness Report 2024
Age at death inside a life
That country’s life tables by sex
Causes of death
WHO and GBD patterns by region and age
Past and coming worlds, beyond the lines above
Maddison Project 2020, UCDP/PRIO and Lee-Lee 2016, with the UN population and urbanization series
The range across the 141 countries
Every cell below is a figure from the 141 birthplaces, not a new calculation from the original yearbooks. Where several countries share the lowest or highest figure, they are listed together. A floor shared by many countries is given as a count.
Figure
Lowest
Highest
Income per person (PPP)
$900 in South Sudan
$130,297 in Singapore
Life expectancy
54.5 years in Nigeria
84.7 years in Japan
Chance of dying before age 5
0.2% in Belarus, Finland, Japan, Norway, and Sweden
11.7% in Nigeria
Chance of dying before age 1
0.2% in Belarus, Czechia, Finland, Italy, Japan, Norway, Singapore, South Korea, and Sweden
7.2% in South Sudan
Children per woman
0.72 in South Korea
6.13 in Somalia
Expected years of schooling
5.6 years in South Sudan
20.8 years in Greece
University enrollment
3% in Eritrea, Malawi, South Sudan, and the Central African Republic
100% in Argentina, Australia, Finland, Greece, South Korea, and Turkey
Income inequality (Gini)
0.24 in Belarus and Slovakia
0.59 in Namibia
Life satisfaction
1.72 / 10 in Afghanistan
7.74 / 10 in Finland
Women married before 18
0.5% on 28 birthplaces
76% in Niger
Maternal mortality
1 per 100,000 in Belarus
1,223 per 100,000 in South Sudan
HIV, adults
0% in Syria
19.82% in Lesotho
Homicide
0.1 per 100,000 in Singapore
51.9 per 100,000 in Jamaica
Road traffic deaths
1.7 per 100,000 in Singapore
64.6 per 100,000 in the Dominican Republic
Out-of-pocket health costs
4% in Botswana
77% in Afghanistan and Turkmenistan
People working in farming
0% in Singapore
86% in Burundi
People using the internet
0% in North Korea
100% in Kuwait, Saudi Arabia, and the United Arab Emirates
People living in cities
15% in Papua New Guinea
100% in Kuwait and Singapore
Smoking is given as two shares. The highest share of men who smoke is 72% in Myanmar. The highest share of women who smoke is 39% in Serbia.
What is estimated
Some road-death rates and some child-marriage rates, and other missing values, were estimated from regional averages and similar methods. A few values without recent data are filled in from regional averages.
Estimated cells are not marked one by one. The rate is still shown, and a regional fill is used where a recent national figure was missing. Data from the World Bank, Our World in Data, the Maddison Project and UCDP (CC BY 4.0) and the UN (CC BY 3.0 IGO) were adapted.
Today, a past year, and the coming world
Today’s world is calculated with today’s statistics. A past world uses that year’s. The coming world uses UN and other projections. Births and population in those other worlds still come from UN World Population Prospects 2024. Urbanization in them also uses World Urbanization Prospects 2018.
Income and conflict further back use the Maddison Project 2020 and UCDP/PRIO. Education further back uses Lee-Lee 2016. Those three apply when the world is not today. The 141 birthplaces are the present-world cards.
Lines with no dataset named
Religion, major cities, common disasters and where people move are shown for each country. No dataset is named for those four. They sit outside the real-statistics set.
Where people move is left off some countries. The birthplace comparison names the fifteen that leave that line off. Life satisfaction is the only real-data line that is blank for some countries, and it is blank only where the World Happiness Report 2024 has no score.
15 countries leave off where people move.
How to read a country against this list
Open a country from Countries. The share of births and the odds are the babies-born-now weight. The rounded population under the name is the other weight.
Read life expectancy as the combined years, with women and men in the same cell. The age at death in a life uses the life tables behind that pair.
Read income as GDP per capita, PPP. The Gini beside it is the distribution a life’s income is drawn from. Amounts in the life are those PPP dollars in US terms.
Life satisfaction is a score out of 10 from the World Happiness Report 2024. If the line is absent, that report has no score for the country.
Treat a road-death rate or a child-marriage rate as a figure that may be a regional estimate where a recent national figure was missing. Those two rates, and other missing values, are the ones filled that way.