
141 birthplaces
See the statistics for all 141 countries
English and Korean each list 141 birthplaces, Slovakia included. Every row below is one of them. The share of births and the odds are the babies-born-now weights. Life expectancy, income and the group line sit with that country. The same statistics are available in English and in Korean.
| Group | |||||
|---|---|---|---|---|---|
| IndiaIn EnglishIn Korean | South Asia | 17.68% | 1 in 6 | 72.0 years | $8,871 |
| ChinaIn EnglishIn Korean | East Asia & Pacific | 6.78% | 1 in 15 | 77.9 years | $22,687 |
| NigeriaIn EnglishIn Korean | Sub-Saharan Africa | 5.72% | 1 in 17 | 54.5 years | $7,843 |
| PakistanIn EnglishIn Korean | South Asia | 5.24% | 1 in 19 | 67.6 years | $5,419 |
| IndonesiaIn EnglishIn Korean | East Asia & Pacific | 3.41% | 1 in 29 | 71.1 years | $13,890 |
| DR CongoIn EnglishIn Korean | Sub-Saharan Africa | 3.33% | 1 in 30 | 61.9 years | $1,559 |
| EthiopiaIn EnglishIn Korean | Sub-Saharan Africa | 3.13% | 1 in 32 | 67.3 years | $2,758 |
| the United StatesIn EnglishIn Korean | High-income countries | 2.78% | 1 in 36 | 79.3 years | $74,352 |
| BangladeshIn EnglishIn Korean | South Asia | 2.66% | 1 in 38 | 74.7 years | $8,242 |
| BrazilIn EnglishIn Korean | Latin America & Caribbean | 1.98% | 1 in 50 | 75.8 years | $19,080 |
| EgyptIn EnglishIn Korean | Middle East & North Africa | 1.83% | 1 in 55 | 71.6 years | $16,691 |
| TanzaniaIn EnglishIn Korean | Sub-Saharan Africa | 1.79% | 1 in 56 | 67.0 years | $3,621 |
| MexicoIn EnglishIn Korean | Latin America & Caribbean | 1.55% | 1 in 64 | 75.1 years | $21,865 |
| the PhilippinesIn EnglishIn Korean | East Asia & Pacific | 1.40% | 1 in 71 | 69.8 years | $9,899 |
| UgandaIn EnglishIn Korean | Sub-Saharan Africa | 1.30% | 1 in 77 | 68.3 years | $2,791 |
| SudanIn EnglishIn Korean | Sub-Saharan Africa | 1.28% | 1 in 78 | 66.3 years | $2,181 |
| KenyaIn EnglishIn Korean | Sub-Saharan Africa | 1.14% | 1 in 88 | 63.6 years | $5,692 |
| AfghanistanIn EnglishIn Korean | South Asia | 1.12% | 1 in 89 | 66.0 years | $1,984 |
| VietnamIn EnglishIn Korean | East Asia & Pacific | 1.06% | 1 in 95 | 74.6 years | $13,535 |
| YemenIn EnglishIn Korean | Middle East & North Africa | 1.06% | 1 in 95 | 69.3 years | $2,000 |
| AngolaIn EnglishIn Korean | Sub-Saharan Africa | 1.05% | 1 in 95 | 64.6 years | $8,598 |
| RussiaIn EnglishIn Korean | Europe & Central Asia | 0.99% | 1 in 101 | 73.2 years | $39,881 |
| MozambiqueIn EnglishIn Korean | Sub-Saharan Africa | 0.96% | 1 in 104 | 63.6 years | $1,513 |
| South AfricaIn EnglishIn Korean | Sub-Saharan Africa | 0.90% | 1 in 111 | 66.1 years | $13,695 |
| IranIn EnglishIn Korean | Middle East & North Africa | 0.89% | 1 in 112 | 77.7 years | $17,045 |
| IraqIn EnglishIn Korean | Middle East & North Africa | 0.88% | 1 in 113 | 72.3 years | $13,202 |
| NigerIn EnglishIn Korean | Sub-Saharan Africa | 0.83% | 1 in 120 | 61.2 years | $1,713 |
| TurkeyIn EnglishIn Korean | Europe & Central Asia | 0.82% | 1 in 123 | 77.2 years | $35,069 |
| Côte d'IvoireIn EnglishIn Korean | Sub-Saharan Africa | 0.76% | 1 in 132 | 61.9 years | $6,521 |
| MadagascarIn EnglishIn Korean | Sub-Saharan Africa | 0.76% | 1 in 131 | 63.6 years | $1,630 |
| CameroonIn EnglishIn Korean | Sub-Saharan Africa | 0.73% | 1 in 137 | 64.0 years | $4,875 |
| MaliIn EnglishIn Korean | Sub-Saharan Africa | 0.72% | 1 in 138 | 60.4 years | $2,861 |
| UzbekistanIn EnglishIn Korean | Europe & Central Asia | 0.72% | 1 in 139 | 72.4 years | $10,514 |
| AlgeriaIn EnglishIn Korean | Middle East & North Africa | 0.69% | 1 in 145 | 76.3 years | $15,159 |
| MyanmarIn EnglishIn Korean | East Asia & Pacific | 0.69% | 1 in 145 | 66.9 years | $5,364 |
| GhanaIn EnglishIn Korean | Sub-Saharan Africa | 0.68% | 1 in 148 | 65.5 years | $6,809 |
| ChadIn EnglishIn Korean | Sub-Saharan Africa | 0.62% | 1 in 160 | 55.1 years | $2,434 |
| SomaliaIn EnglishIn Korean | Sub-Saharan Africa | 0.60% | 1 in 167 | 58.8 years | $1,402 |
| JapanIn EnglishIn Korean | High-income countries | 0.57% | 1 in 175 | 84.7 years | $47,387 |
| Burkina FasoIn EnglishIn Korean | Sub-Saharan Africa | 0.55% | 1 in 180 | 61.1 years | $2,486 |
| GermanyIn EnglishIn Korean | High-income countries | 0.55% | 1 in 183 | 81.4 years | $63,140 |
| ColombiaIn EnglishIn Korean | Latin America & Caribbean | 0.54% | 1 in 186 | 77.7 years | $18,407 |
| the United KingdomIn EnglishIn Korean | High-income countries | 0.52% | 1 in 191 | 81.3 years | $53,423 |
| ZambiaIn EnglishIn Korean | Sub-Saharan Africa | 0.52% | 1 in 192 | 66.3 years | $3,673 |
| MalawiIn EnglishIn Korean | Sub-Saharan Africa | 0.50% | 1 in 198 | 67.4 years | $1,649 |
| FranceIn EnglishIn Korean | High-income countries | 0.49% | 1 in 206 | 83.3 years | $54,297 |
| MoroccoIn EnglishIn Korean | Middle East & North Africa | 0.48% | 1 in 209 | 75.3 years | $8,915 |
| ThailandIn EnglishIn Korean | East Asia & Pacific | 0.45% | 1 in 222 | 76.4 years | $21,245 |
| NepalIn EnglishIn Korean | South Asia | 0.44% | 1 in 229 | 70.4 years | $4,861 |
| Saudi ArabiaIn EnglishIn Korean | Middle East & North Africa | 0.42% | 1 in 241 | 78.7 years | $64,482 |
| PeruIn EnglishIn Korean | Latin America & Caribbean | 0.41% | 1 in 243 | 77.7 years | $15,342 |
| SenegalIn EnglishIn Korean | Sub-Saharan Africa | 0.40% | 1 in 247 | 68.7 years | $4,305 |
| SyriaIn EnglishIn Korean | Middle East & North Africa | 0.40% | 1 in 252 | 72.1 years | $4,579 |
| ArgentinaIn EnglishIn Korean | Latin America & Caribbean | 0.38% | 1 in 261 | 77.4 years | $27,230 |
| ZimbabweIn EnglishIn Korean | Sub-Saharan Africa | 0.38% | 1 in 264 | 62.8 years | $5,218 |
| GuineaIn EnglishIn Korean | Sub-Saharan Africa | 0.37% | 1 in 269 | 60.7 years | $3,905 |
| BeninIn EnglishIn Korean | Sub-Saharan Africa | 0.36% | 1 in 275 | 60.8 years | $3,721 |
| BurundiIn EnglishIn Korean | Sub-Saharan Africa | 0.35% | 1 in 285 | 63.7 years | $1,033 |
| MalaysiaIn EnglishIn Korean | East Asia & Pacific | 0.33% | 1 in 301 | 76.7 years | $32,858 |
| VenezuelaIn EnglishIn Korean | Latin America & Caribbean | 0.33% | 1 in 308 | 72.5 years | $7,500 |
| KazakhstanIn EnglishIn Korean | Europe & Central Asia | 0.31% | 1 in 321 | 74.4 years | $34,703 |
| RwandaIn EnglishIn Korean | Sub-Saharan Africa | 0.30% | 1 in 332 | 67.8 years | $3,168 |
| GuatemalaIn EnglishIn Korean | Latin America & Caribbean | 0.29% | 1 in 348 | 72.6 years | $12,380 |
| ItalyIn EnglishIn Korean | High-income countries | 0.29% | 1 in 342 | 83.7 years | $52,843 |
| CambodiaIn EnglishIn Korean | East Asia & Pacific | 0.28% | 1 in 363 | 70.7 years | $6,695 |
| CanadaIn EnglishIn Korean | High-income countries | 0.27% | 1 in 368 | 82.6 years | $58,088 |
| SpainIn EnglishIn Korean | High-income countries | 0.26% | 1 in 390 | 83.7 years | $47,323 |
| North KoreaIn EnglishIn Korean | East Asia & Pacific | 0.26% | 1 in 384 | 73.6 years | $1,700 |
| Sri LankaIn EnglishIn Korean | South Asia | 0.25% | 1 in 405 | 77.5 years | $13,065 |
| South SudanIn EnglishIn Korean | Sub-Saharan Africa | 0.25% | 1 in 400 | 57.6 years | $900 |
| PolandIn EnglishIn Korean | High-income countries | 0.24% | 1 in 413 | 78.6 years | $43,673 |
| AustraliaIn EnglishIn Korean | High-income countries | 0.23% | 1 in 432 | 83.9 years | $60,685 |
| EcuadorIn EnglishIn Korean | Latin America & Caribbean | 0.21% | 1 in 486 | 77.4 years | $14,321 |
| TajikistanIn EnglishIn Korean | Europe & Central Asia | 0.21% | 1 in 484 | 71.8 years | $4,472 |
| BoliviaIn EnglishIn Korean | Latin America & Caribbean | 0.20% | 1 in 505 | 68.6 years | $11,616 |
| HaitiIn EnglishIn Korean | Latin America & Caribbean | 0.20% | 1 in 508 | 64.9 years | $2,939 |
| Sierra LeoneIn EnglishIn Korean | Sub-Saharan Africa | 0.20% | 1 in 507 | 61.8 years | $3,035 |
| TogoIn EnglishIn Korean | Sub-Saharan Africa | 0.20% | 1 in 489 | 62.7 years | $3,216 |
| Papua New GuineaIn EnglishIn Korean | East Asia & Pacific | 0.19% | 1 in 514 | 66.1 years | $4,206 |
| the Central African RepublicIn EnglishIn Korean | Sub-Saharan Africa | 0.18% | 1 in 550 | 57.4 years | $1,133 |
| HondurasIn EnglishIn Korean | Latin America & Caribbean | 0.18% | 1 in 562 | 72.9 years | $6,468 |
| JordanIn EnglishIn Korean | Middle East & North Africa | 0.18% | 1 in 557 | 77.8 years | $10,309 |
| South KoreaIn EnglishIn Korean | High-income countries | 0.18% | 1 in 556 | 84.3 years | $54,029 |
| UkraineIn EnglishIn Korean | Europe & Central Asia | 0.16% | 1 in 619 | 73.4 years | $15,917 |
| the Dominican RepublicIn EnglishIn Korean | Latin America & Caribbean | 0.15% | 1 in 646 | 73.7 years | $23,282 |
| the Republic of the CongoIn EnglishIn Korean | Sub-Saharan Africa | 0.14% | 1 in 694 | 65.8 years | $6,172 |
| RomaniaIn EnglishIn Korean | Europe & Central Asia | 0.14% | 1 in 715 | 75.9 years | $40,117 |
| ChileIn EnglishIn Korean | Latin America & Caribbean | 0.13% | 1 in 746 | 81.2 years | $29,600 |
| IsraelIn EnglishIn Korean | High-income countries | 0.13% | 1 in 762 | 82.4 years | $47,671 |
| LiberiaIn EnglishIn Korean | Sub-Saharan Africa | 0.13% | 1 in 772 | 62.2 years | $1,617 |
| MauritaniaIn EnglishIn Korean | Sub-Saharan Africa | 0.13% | 1 in 760 | 68.5 years | $6,276 |
| the NetherlandsIn EnglishIn Korean | High-income countries | 0.13% | 1 in 783 | 82.2 years | $70,199 |
| TunisiaIn EnglishIn Korean | Middle East & North Africa | 0.13% | 1 in 783 | 76.5 years | $12,651 |
| LaosIn EnglishIn Korean | East Asia & Pacific | 0.12% | 1 in 806 | 69.0 years | $8,372 |
| TurkmenistanIn EnglishIn Korean | Europe & Central Asia | 0.12% | 1 in 820 | 70.1 years | $17,686 |
| KyrgyzstanIn EnglishIn Korean | Europe & Central Asia | 0.11% | 1 in 871 | 71.7 years | $6,576 |
| PalestineIn EnglishIn Korean | Middle East & North Africa | 0.11% | 1 in 897 | 65.2 years | $5,562 |
| AzerbaijanIn EnglishIn Korean | Europe & Central Asia | 0.10% | 1 in 1,050 | 74.4 years | $21,311 |
| NicaraguaIn EnglishIn Korean | Latin America & Caribbean | 0.10% | 1 in 994 | 74.9 years | $7,497 |
| ParaguayIn EnglishIn Korean | Latin America & Caribbean | 0.10% | 1 in 960 | 73.8 years | $15,832 |
| TaiwanIn EnglishIn Korean | High-income countries | 0.10% | 1 in 992 | 80.6 years | $70,000 |
| LibyaIn EnglishIn Korean | Middle East & North Africa | 0.09% | 1 in 1,056 | 69.3 years | $12,477 |
| the United Arab EmiratesIn EnglishIn Korean | Middle East & North Africa | 0.08% | 1 in 1,263 | 82.9 years | $70,240 |
| BelgiumIn EnglishIn Korean | High-income countries | 0.08% | 1 in 1,292 | 82.1 years | $63,042 |
| EritreaIn EnglishIn Korean | Sub-Saharan Africa | 0.08% | 1 in 1,326 | 68.6 years | $1,800 |
| El SalvadorIn EnglishIn Korean | Latin America & Caribbean | 0.08% | 1 in 1,321 | 72.1 years | $11,404 |
| CubaIn EnglishIn Korean | Latin America & Caribbean | 0.07% | 1 in 1,369 | 78.1 years | $12,000 |
| CzechiaIn EnglishIn Korean | High-income countries | 0.07% | 1 in 1,430 | 79.8 years | $47,558 |
| LebanonIn EnglishIn Korean | Middle East & North Africa | 0.07% | 1 in 1,409 | 77.8 years | $11,330 |
| PortugalIn EnglishIn Korean | High-income countries | 0.07% | 1 in 1,516 | 82.4 years | $41,768 |
| SwedenIn EnglishIn Korean | High-income countries | 0.07% | 1 in 1,342 | 83.3 years | $62,123 |
| AustriaIn EnglishIn Korean | High-income countries | 0.06% | 1 in 1,705 | 82.0 years | $64,536 |
| SwitzerlandIn EnglishIn Korean | High-income countries | 0.06% | 1 in 1,569 | 83.9 years | $85,383 |
| the GambiaIn EnglishIn Korean | Sub-Saharan Africa | 0.06% | 1 in 1,600 | 65.9 years | $2,964 |
| GreeceIn EnglishIn Korean | High-income countries | 0.06% | 1 in 1,783 | 81.9 years | $36,701 |
| HungaryIn EnglishIn Korean | Europe & Central Asia | 0.06% | 1 in 1,539 | 77.0 years | $40,333 |
| NamibiaIn EnglishIn Korean | Sub-Saharan Africa | 0.06% | 1 in 1,712 | 67.4 years | $10,126 |
| OmanIn EnglishIn Korean | Middle East & North Africa | 0.06% | 1 in 1,544 | 80.0 years | $37,794 |
| BulgariaIn EnglishIn Korean | Europe & Central Asia | 0.05% | 1 in 2,097 | 75.6 years | $33,074 |
| BelarusIn EnglishIn Korean | Europe & Central Asia | 0.05% | 1 in 2,019 | 74.4 years | $27,782 |
| BotswanaIn EnglishIn Korean | Sub-Saharan Africa | 0.05% | 1 in 2,143 | 69.2 years | $18,932 |
| GabonIn EnglishIn Korean | Sub-Saharan Africa | 0.05% | 1 in 1,911 | 68.3 years | $18,701 |
| Guinea-BissauIn EnglishIn Korean | Sub-Saharan Africa | 0.05% | 1 in 2,031 | 64.1 years | $2,661 |
| MongoliaIn EnglishIn Korean | East Asia & Pacific | 0.05% | 1 in 2,020 | 71.7 years | $16,223 |
| New ZealandIn EnglishIn Korean | High-income countries | 0.05% | 1 in 2,218 | 82.1 years | $49,593 |
| PanamaIn EnglishIn Korean | Latin America & Caribbean | 0.05% | 1 in 1,838 | 79.6 years | $35,873 |
| SerbiaIn EnglishIn Korean | Europe & Central Asia | 0.05% | 1 in 2,195 | 76.8 years | $25,735 |
| Costa RicaIn EnglishIn Korean | Latin America & Caribbean | 0.04% | 1 in 2,528 | 80.8 years | $26,379 |
| DenmarkIn EnglishIn Korean | High-income countries | 0.04% | 1 in 2,272 | 81.9 years | $68,994 |
| Equatorial GuineaIn EnglishIn Korean | Sub-Saharan Africa | 0.04% | 1 in 2,402 | 63.7 years | $15,302 |
| IrelandIn EnglishIn Korean | High-income countries | 0.04% | 1 in 2,466 | 82.4 years | $117,660 |
| KuwaitIn EnglishIn Korean | Middle East & North Africa | 0.04% | 1 in 2,662 | 80.4 years | $47,790 |
| LesothoIn EnglishIn Korean | Sub-Saharan Africa | 0.04% | 1 in 2,357 | 57.4 years | $2,592 |
| NorwayIn EnglishIn Korean | High-income countries | 0.04% | 1 in 2,548 | 83.3 years | $94,365 |
| SingaporeIn EnglishIn Korean | High-income countries | 0.04% | 1 in 2,767 | 83.7 years | $130,297 |
| SlovakiaIn EnglishIn Korean | High-income countries | 0.04% | 1 in 2,513 | 78.3 years | $39,502 |
| FinlandIn EnglishIn Korean | High-income countries | 0.03% | 1 in 3,016 | 81.9 years | $56,052 |
| GeorgiaIn EnglishIn Korean | Europe & Central Asia | 0.03% | 1 in 3,001 | 74.5 years | $22,591 |
| JamaicaIn EnglishIn Korean | Latin America & Caribbean | 0.03% | 1 in 3,980 | 71.5 years | $11,399 |
| UruguayIn EnglishIn Korean | Latin America & Caribbean | 0.03% | 1 in 3,928 | 78.1 years | $31,101 |
| QatarIn EnglishIn Korean | Middle East & North Africa | 0.02% | 1 in 4,450 | 82.4 years | $116,159 |
How to use this list
- Search an English birthplace name. Each row shows the income group, the share of births, the odds, life expectancy, and income per person.
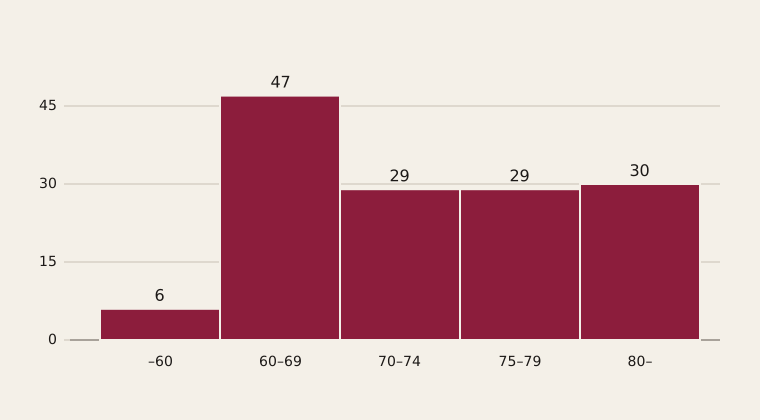
- Narrow by the group line, by the life expectancy band, or by the odds band. The bands follow the numbers in the table. Under 60 through 80 and over are the same cuts as the chart below.
- Order the rows by share of births, by odds, by life expectancy, or by income. A smaller odds number is a more common birthplace: India is 1 in 6, the most common.
- Compare two birthplaces from the menus under the list. The comparison uses the same five columns as the table.
- The English and Korean links on a row open that birthplace in that language, with every figure and the wording used there.
What the odds are
Each country leads with a share of the babies being born now, then odds as 1 in N. India is 17.68 percent, 1 in 6, about 23.2 million births a year. Those odds are the babies-born-now draw. Ordering the rows by odds follows that draw.
The other draw, The 8 billion alive now, weights population instead. That draw has no second odds line beside the birth odds. A rounded population sits in the line under the title. How your country is drawn compares the two weights.
What a row keeps from the page
The group is the income region, shown before the population. The set uses seven: Sub-Saharan Africa, South Asia, East Asia & Pacific, High-income countries, Middle East & North Africa, Latin America & Caribbean, and Europe & Central Asia.
Life expectancy is the combined figure, with women and men in the same cell. Income is GDP per capita at purchasing power parity, labeled Income per person (PPP). All figures opens the rest of the cells, including the ones the short row leaves out.
The figures come from UN World Population Prospects 2024 for births, population, life expectancy and fertility; UN IGME for child mortality; WHO and UN MMEIG for maternal mortality, tobacco and road deaths; UNDP and UNESCO for education; World Bank for income, inequality, internet use and health spending; ILO for agricultural employment; UN-Habitat for urbanization; UNAIDS for HIV; UNODC for homicide; UNICEF for child marriage; and the World Happiness Report 2024. A few values without recent data are estimates filled in from regional averages.
Birth shares by group
Each country rounds its share of births to two decimals. The group totals below add those shares. Added up, they come to 99.99 percent.
| Group | Birthplaces | Share of births |
|---|---|---|
| Sub-Saharan Africa | 42 | 31.69% |
| South Asia | 6 | 27.39% |
| East Asia & Pacific | 12 | 15.02% |
| High-income countries | 28 | 7.49% |
| Middle East & North Africa | 17 | 7.43% |
| Latin America & Caribbean | 21 | 7.05% |
| Europe & Central Asia | 15 | 3.92% |
Life expectancy across the 141
The shortest combined life expectancy is Nigeria, 54.5 years (women 55.2 · men 53.8). The longest is Japan, 84.7 years (women 87.6 · men 81.6). The chart counts every country once, using that combined figure. The filter above uses the same five bands.
Lines the pages leave off
Life satisfaction is blank where the World Happiness Report 2024 has no score. That is 7 birthplaces: Cuba, Eritrea, Guinea-Bissau, Equatorial Guinea, Oman, Papua New Guinea, North Korea.
15 countries list no move-abroad destination: the United Arab Emirates, Austria, Belgium, Switzerland, Denmark, Finland, Equatorial Guinea, Kuwait, the Netherlands, Norway, Oman, Qatar, Saudi Arabia, Sweden, South Africa.
Length, pause ages and the yearly focus